Your numbers, every month

Reporting

Clear 12-month trends from a handful of numbers a month, a Scorecard that shows your whole practice on one page, and a monthly report on what to focus on next.

On any EHR or none
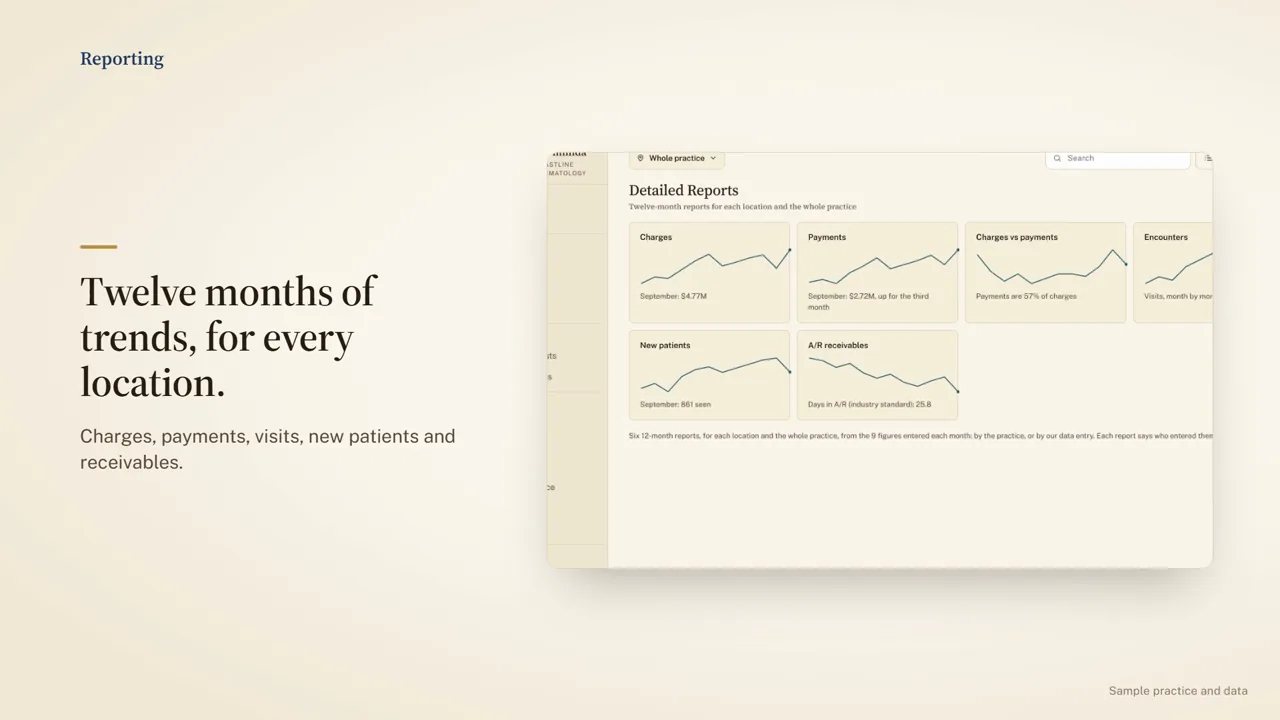
The Reporting film: twelve months of trends for every location, in a sample practice Watch the 1-minute film

What's included

  • 12-month trending reports for charges, payments, visits, new patients and receivables, for each location and the whole practice
  • The Scorecard: your key numbers on one page, twelve months at a time, against targets set from your own history
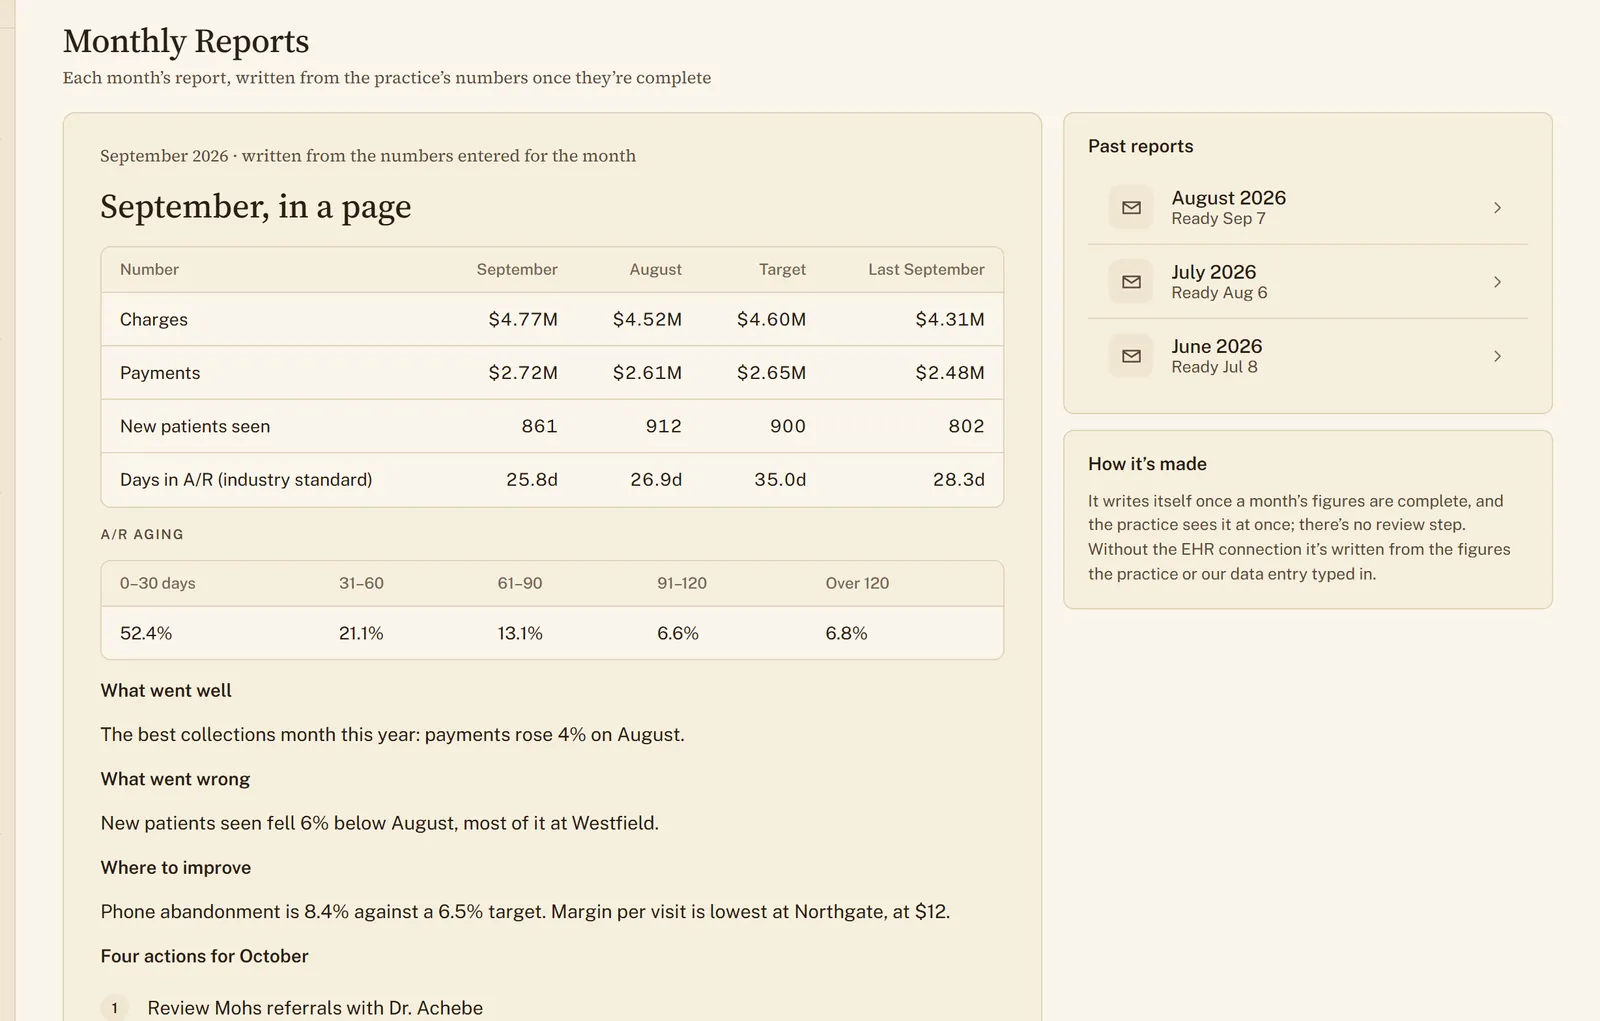
  • The monthly report: what went well, what went wrong, and what to focus on next
  • A short note for owners and managers on what matters most, written by AI whenever new numbers arrive
  • A Business Associate Agreement, and no charge per person

Where the numbers come from

  • Nine figures per location each month from your EHR's reports: charges, payments, visits, new patients seen and receivables by age
  • Your team enters them, or our data entry does, for $147 a month for the first location and $17 for each additional Needs Reporting
  • The Scorecard's other numbers come from your phone system, payroll and books. Every number your team owes has an owner and a backup, and Accountability chases them.
The monthly report for a sample practice: the month in a page, what went well, what went wrong and four actions
The monthly report · sample practice and data

With the EHR connection

Your figures, filled in every night

Your figures arrive from your EHR by week and by month, so data entry ends. The Scorecard adds rows like net collection rate, biopsy ratio and Mohs stages per case, and the detailed reports grow, group by group.

About the EHR connection →

Beyond your EHR

The rest of your business, reported

Your managers enter 15 numbers a month from your phone system, payroll, bank and books. Reporting turns them into monthly trends you've likely never tracked.
  • Cost per new patient: what each new patient costs to win
  • Labor cost as a share of collections: whether staffing is outgrowing revenue
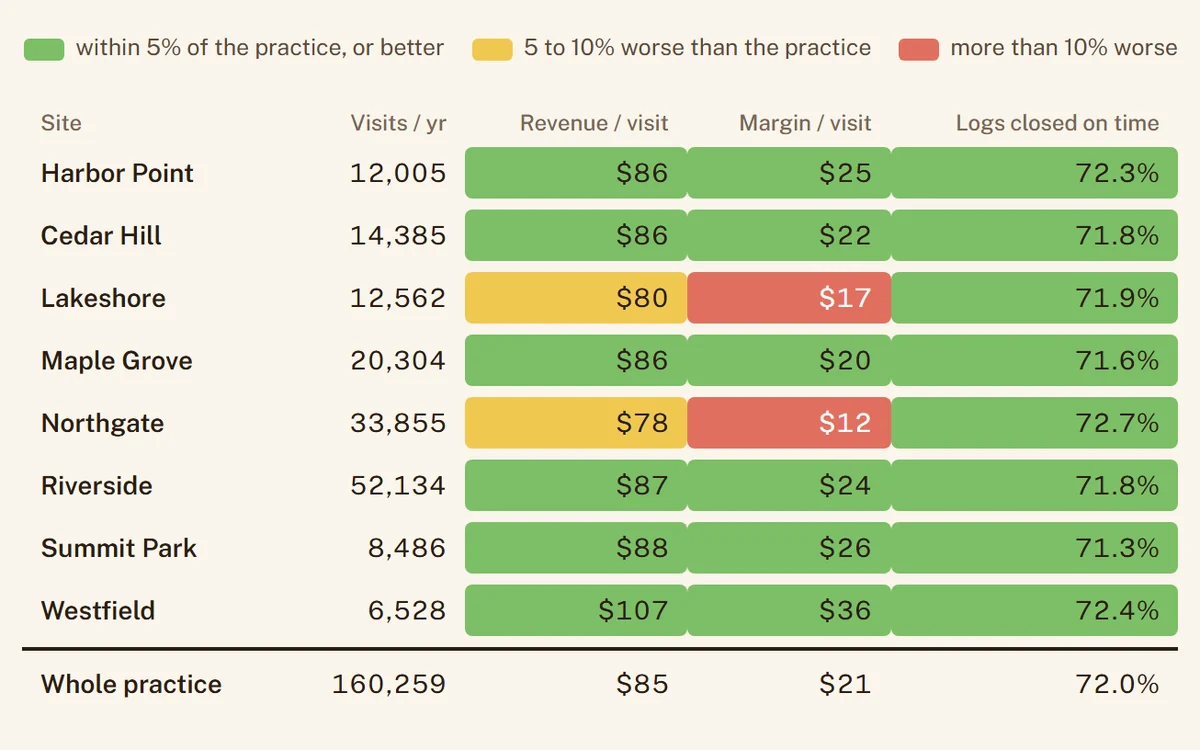
  • What each location makes: the margin a visit leaves after payroll, supplies and rent
  • Days cash on hand: how long you could run if nothing came in
  • Phone abandonment: how many callers hang up before anyone answers
  • Third-next-available: how long a new patient waits for a visit
  • Also payments per clinical hour, overtime, staff turnover and reviews added
What each location makes in a sample practice, over twelve months: margin per visit after payroll, supplies and occupancy, from $12 at Northgate and $17 at Lakeshore, both more than 10% below the practice's $21, to $36 at Westfield, with each location's visits, revenue per visit and logs closed on time
What each location makes · sample practice and data

Entered by the people who have them. Each number has an owner and a backup, and with Accountability, a missing one gets chased.

The other modules